Solutions to Meet Varios Energy Needs
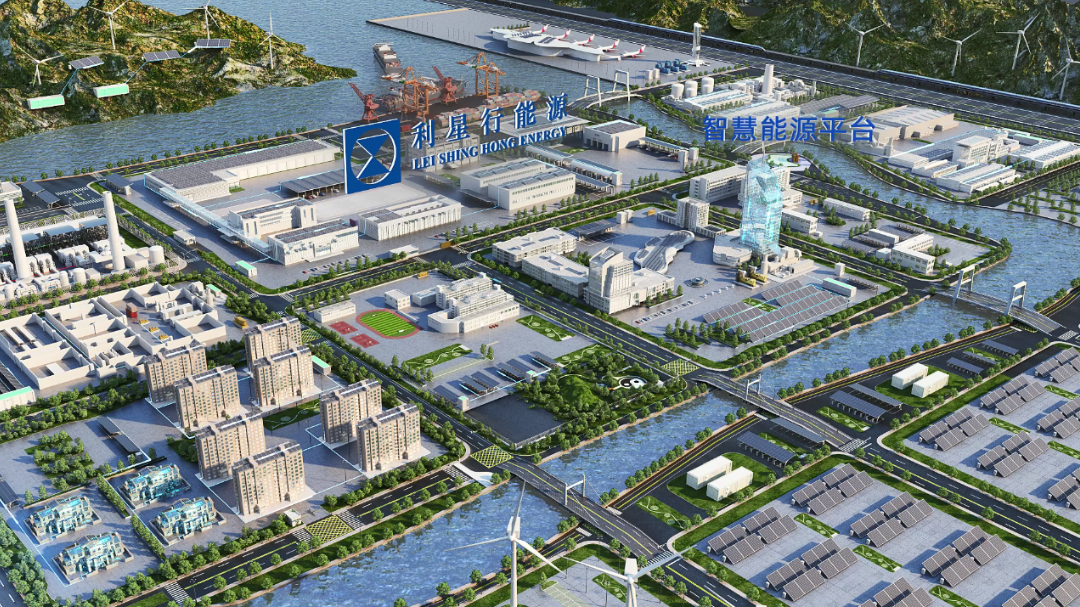
LSHE Smart Integrated Energy Platform can provide comprehensive energy monitoring and control management for various industrial parks and large factories, and is able to monitor the photovoltaics, energy storage and energy usage status of the park in real time, analyze the energy usage structure and emission indicators of the park and large factories based on accurate data. etc., provide reasonable and efficient multi-energy complementary solution to help achieve carbon neutrality.
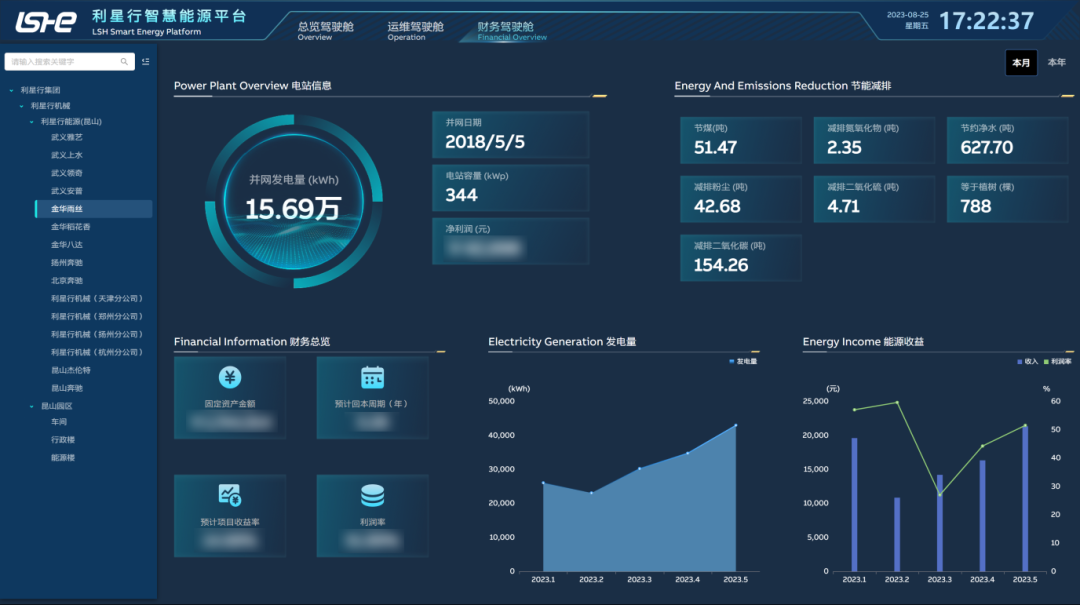
The entire cockpit is mainly divided into three parts, including the Overview Cockpit, Operation and Maintenance Cockpit, and Financial Cockpit.
Through the management platform, the management personnel of the park can check the itemized carbon emission data of various energies at any time, understand the use of carbon emission quota and energy conservation and emission reduction, and promptly control the risks of exceeding carbon emission standards, which can help achieve the overall goals of carbon emissions and carbon emission reduction.
Overview Cockpit: It mainly displays the monitoring data of energy consumption and emissions in the park. It is divided into three sub-modules, namely Park Overview, Park Emission Analysis, and Park Energy Analysis.

Park Overview: It mainly reflects the photovoltaic and energy storage installed capacity, energy usage structure, carbon emission reduction information, energy storage information, and energy income of the park. In addition, it can also monitor the detailed energy consumption and emission reduction of each area of the park in real time on the current day.
Park Emission Analysis: It highlights the current emission indicators of the park, including carbon emission intensity and emission structure analysis, which can help achieve zero-carbon park.

Park Energy Analysis: Users can visually view the current photovoltaic consumption and substitution situation in the park, which can be used to analyze and optimize photovoltaic construction. Moreover, it can be used to calculate the current cost per kilowatt hour of the electricity according to the composition of the energy structure.

Operation and Maintenance Cockpit: It displays the operation status of power stations in different areas in the form of map, and monitors the latest work orders, system events, equipment connection status and gateway connection status in real time to ensure that the operation and maintenance personnel can timely receive the alarm information.

It displays the financial information of different organizations in a hierarchical relationship, including the amount of fixed assets of the power station, the expected payback period, etc., and the current profit of the power station can be calculated in real time according to the cost and income of the power station. In addition, the energy-saving and emission-reduction related content can be converted into electricity generation.